 Figure 1NASCAR Chassis-Dyno Test
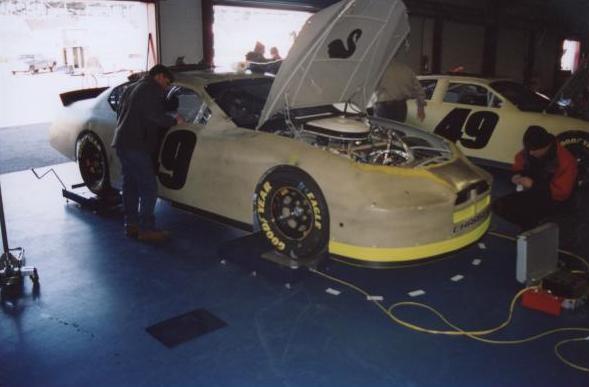
We balance the engine, transmission and driveline all together as one assembly for this particular racecar being prepared to race in the Daytona 500; which increased and widen the power band of the engine.
See the before and after in the Chassis-Dyno SAE J607 Power Data graph.
• Increased Horse Power: 15 HP (NASCAR teams consider any power increase above 3HP as nothing less than a miracle)
• Increased Torque and Acceleration
• Coast down was also the longest ever recorded on this particular Chassis-Dyno, at Joey Arrington’s engine facility, which indicates that every rotating component from the front of the engine to rear gear of the differential is perfectly balanced.
Race Track Test
We can also balance the racecar on the race track, as shown in Figure-2 through Figure-5. First, as color coded in Figure-2 below, the engine overall vibration measured at 31.9313 IPS (as shown outside the graph on the right as OVERALL). Camshaft Frequency is 3318.11 RPM measured 17.7443 IPS (off the chart) and Crankshaft Frequency is 6626.59 RPM measured 11.1664 IPS.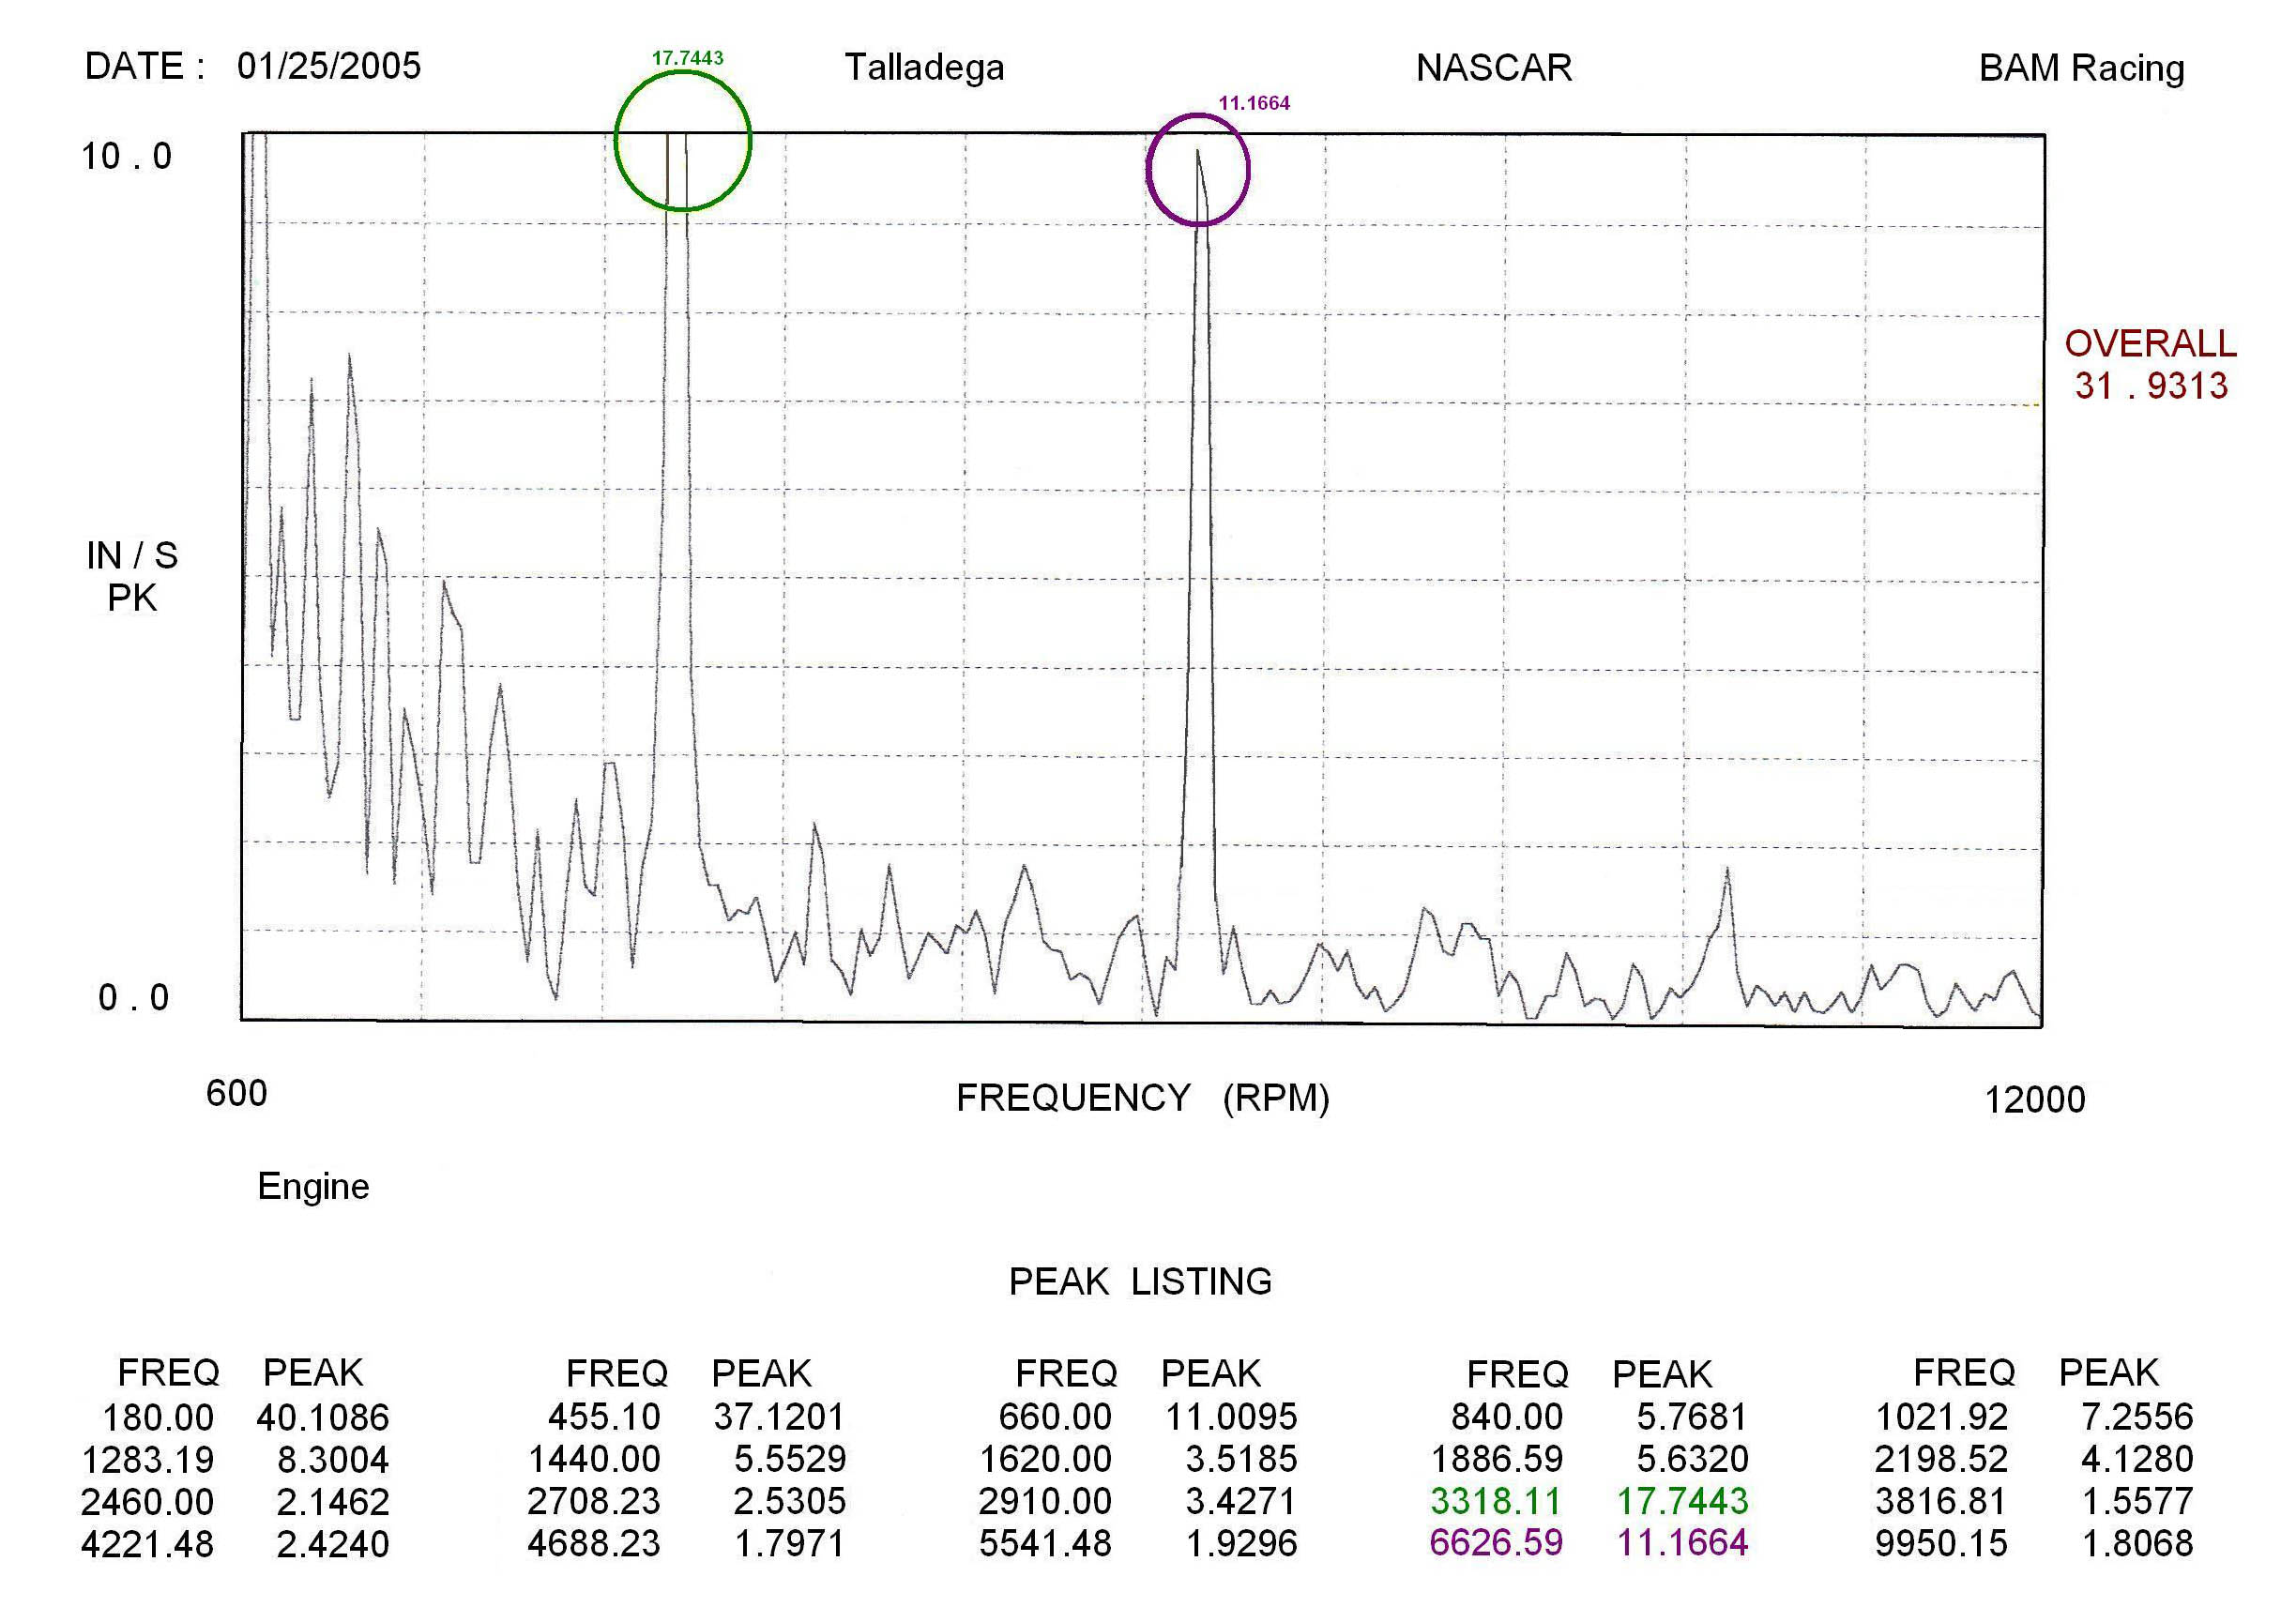 Figure 2 - Engine BEFORE
In the chart below, the transmission and driveline overall vibration measured at 4.4885 IPS (as shown outside the graph on the right). Driveline’s individual peak is measured at 2.0172 IPS.
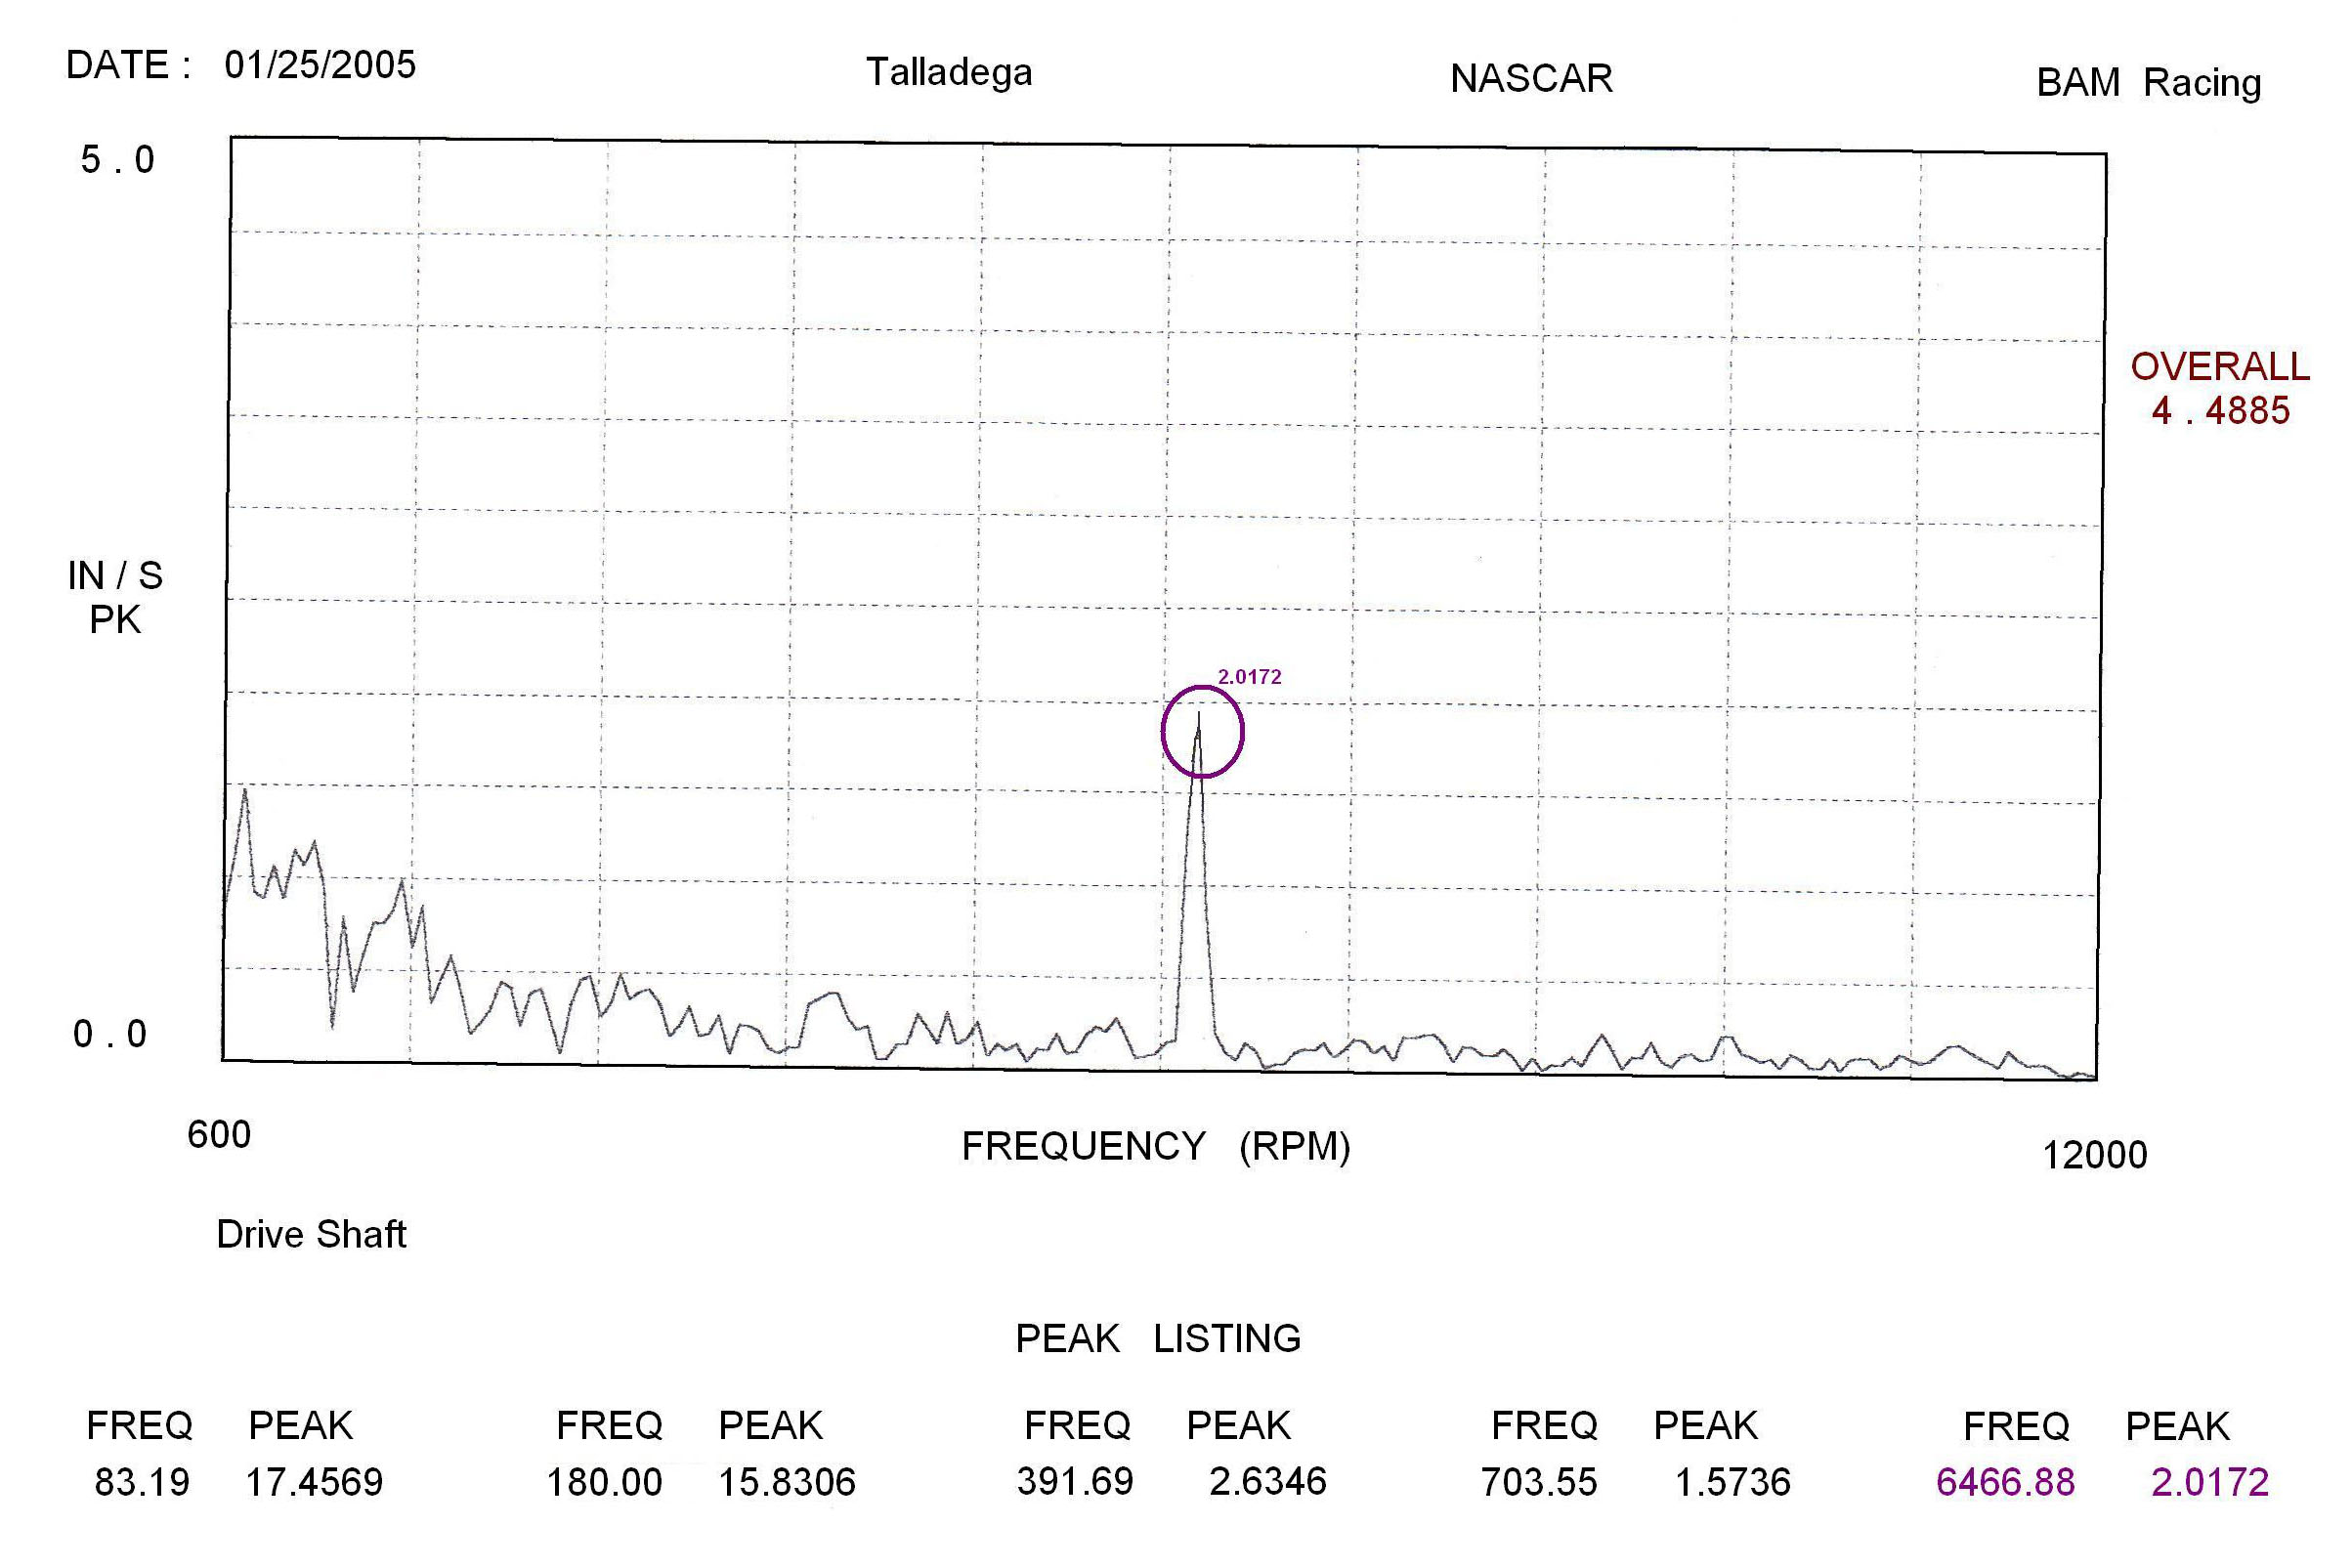 Figure 3 - Drive Shaft BEFORE
NOTE: Vibrations measurements in the two charts above were both recorded simultaneously. Lap time on the 2.5 mile race track in Talladega was clocked at 52.13 seconds during the vibration recording.
 After collecting the baseline measurements, the engine, transmission and driveshaft were then dynamically balanced with two-(2) separate adjustments. For the final measurements, the engine, transmission and driveshaft assembly were again recorded simultaneously in Figure-4 and Figure-5 below.
During the final test run, on the race track, engine’s new overall vibration measured at 2.5653 IPS, as shown below in Figure-4 outside the graph on the right; this is a 92% overall reduction in vibration from the original baseline measurements illustrated in Figure-2.
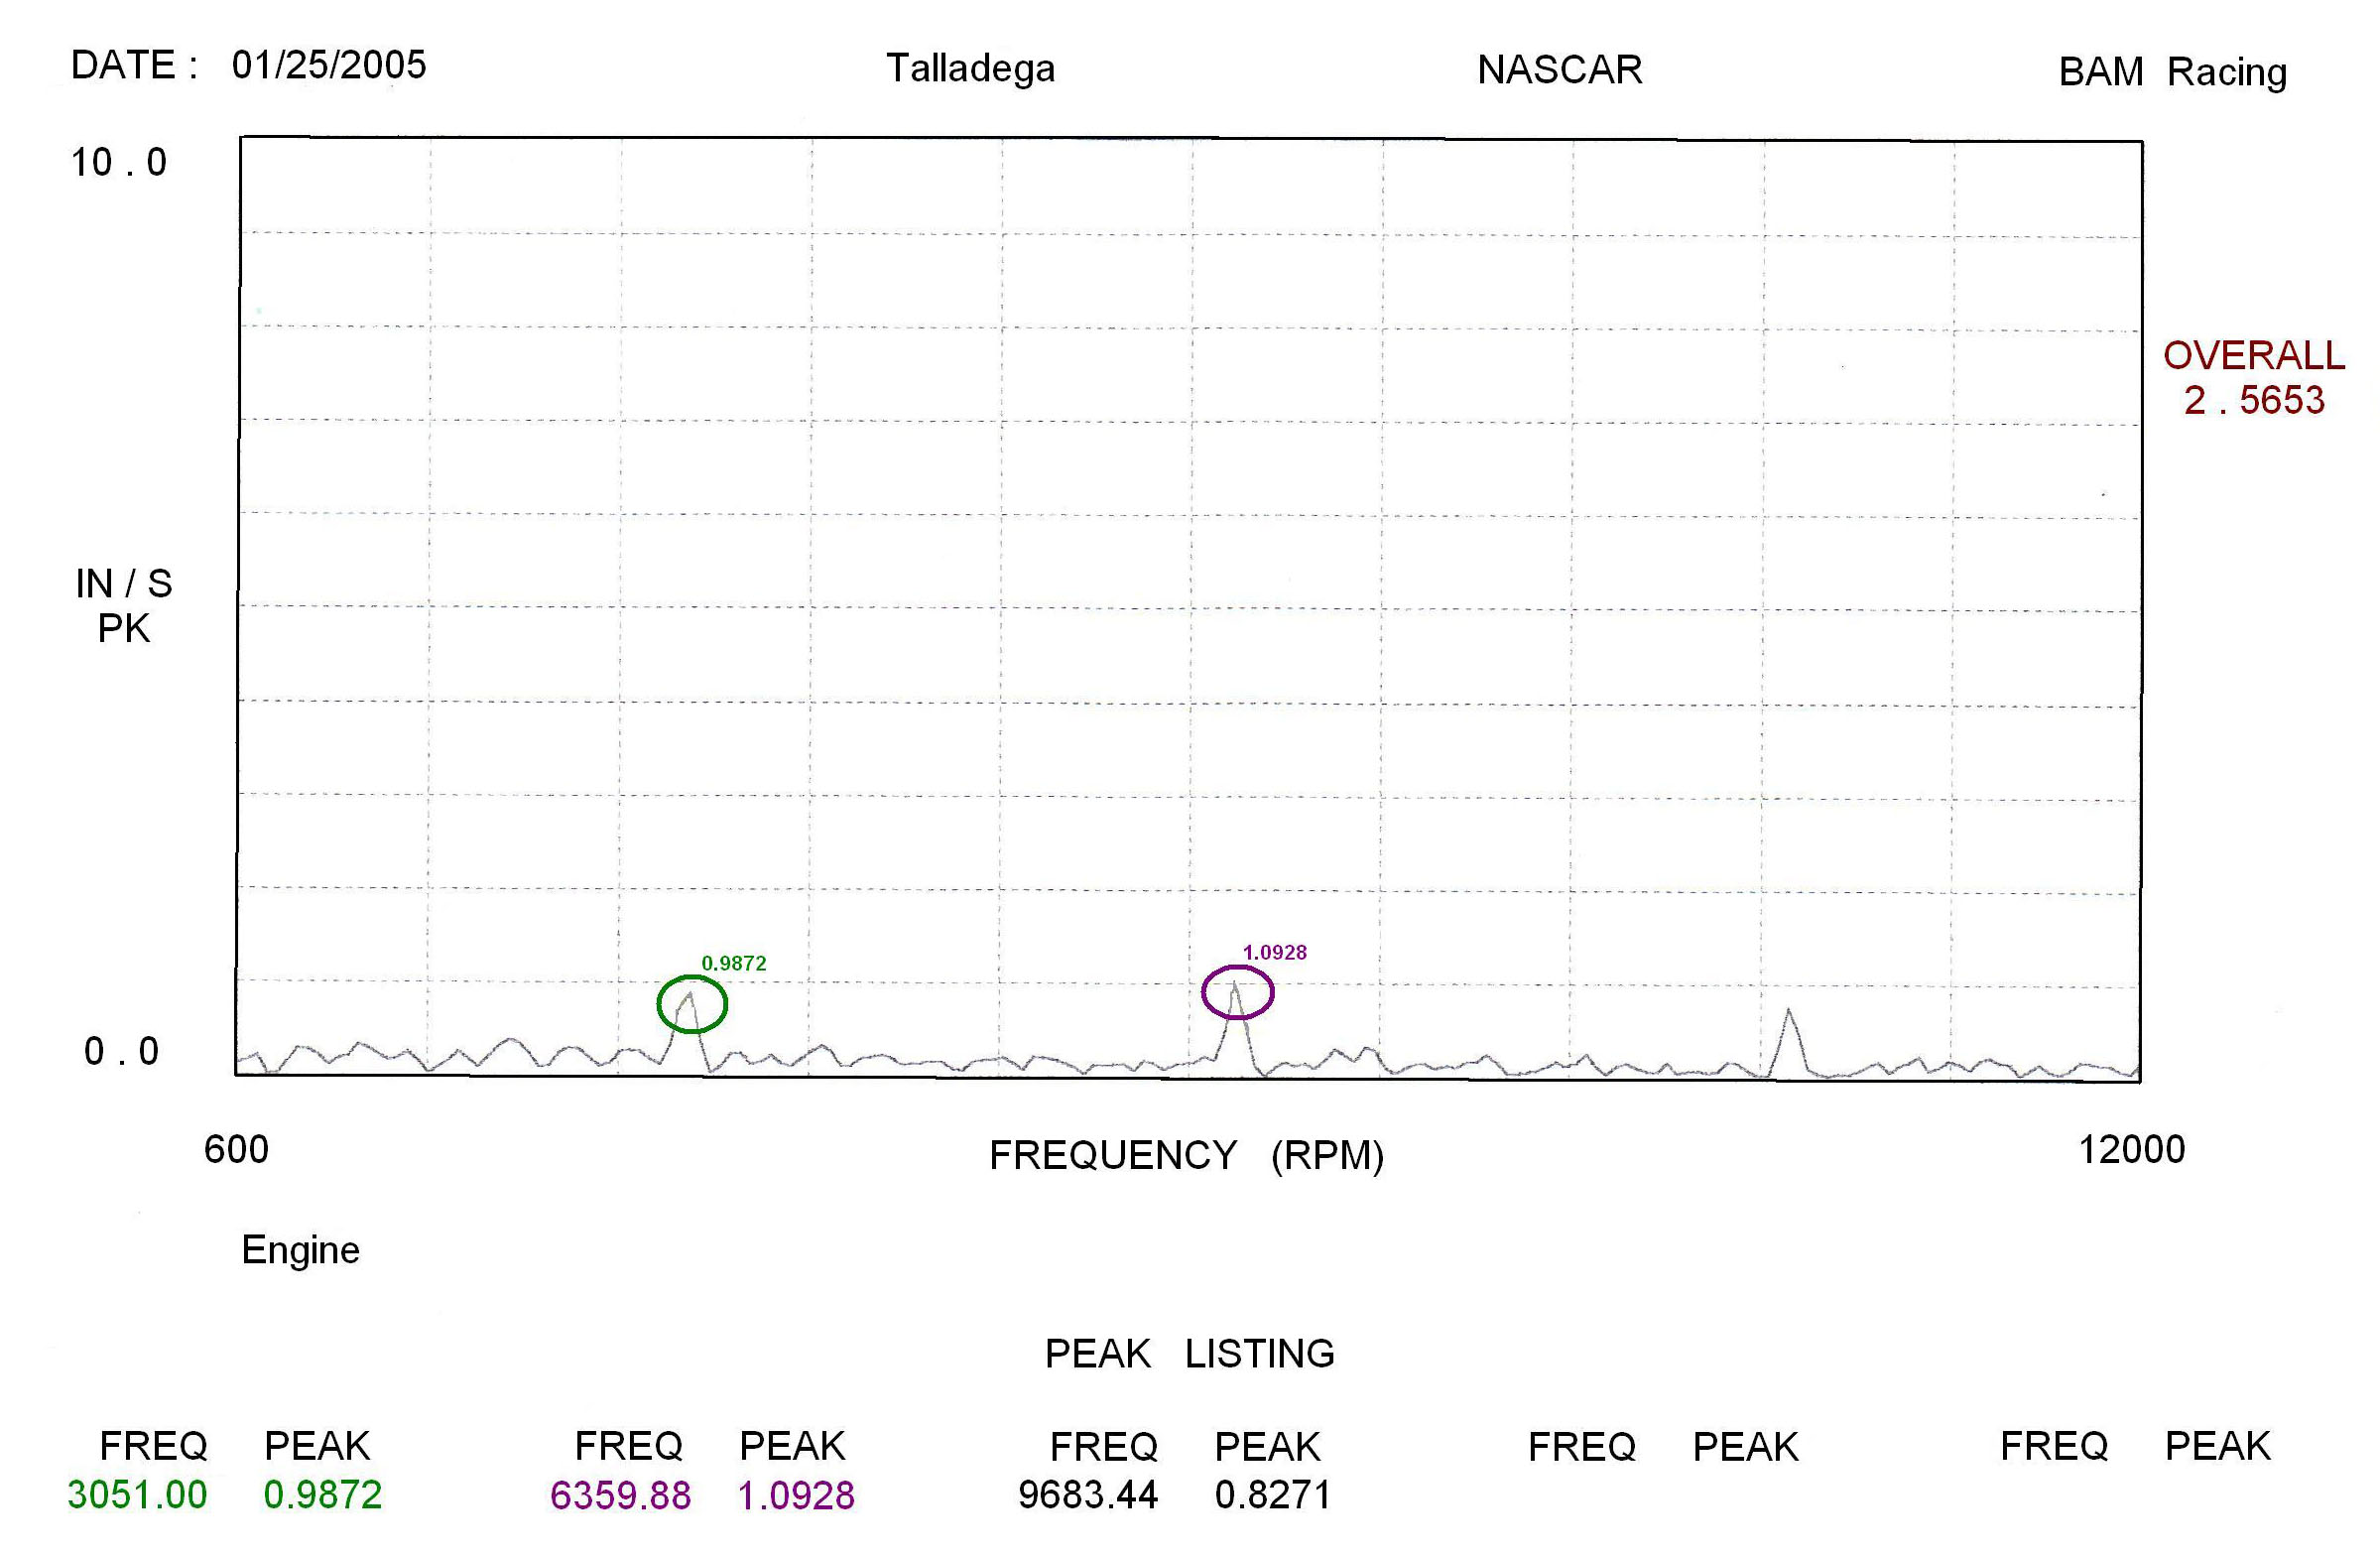 Figure 4 - Engine AFTER
Transmission and driveline’s new overall vibration measured at 2.9088 IPS (as shown outside the graph on the right), in Figure-5; this is a 35.2% overall reduction in vibration from the original baseline measurements in Figure-3. The actual Driveline was balanced from a 2.0172 IPS, in Figure-3, down to 0.3516 IPS, in Figure-5; this is an 82.6% reduction of vibration on the Driveline itself.
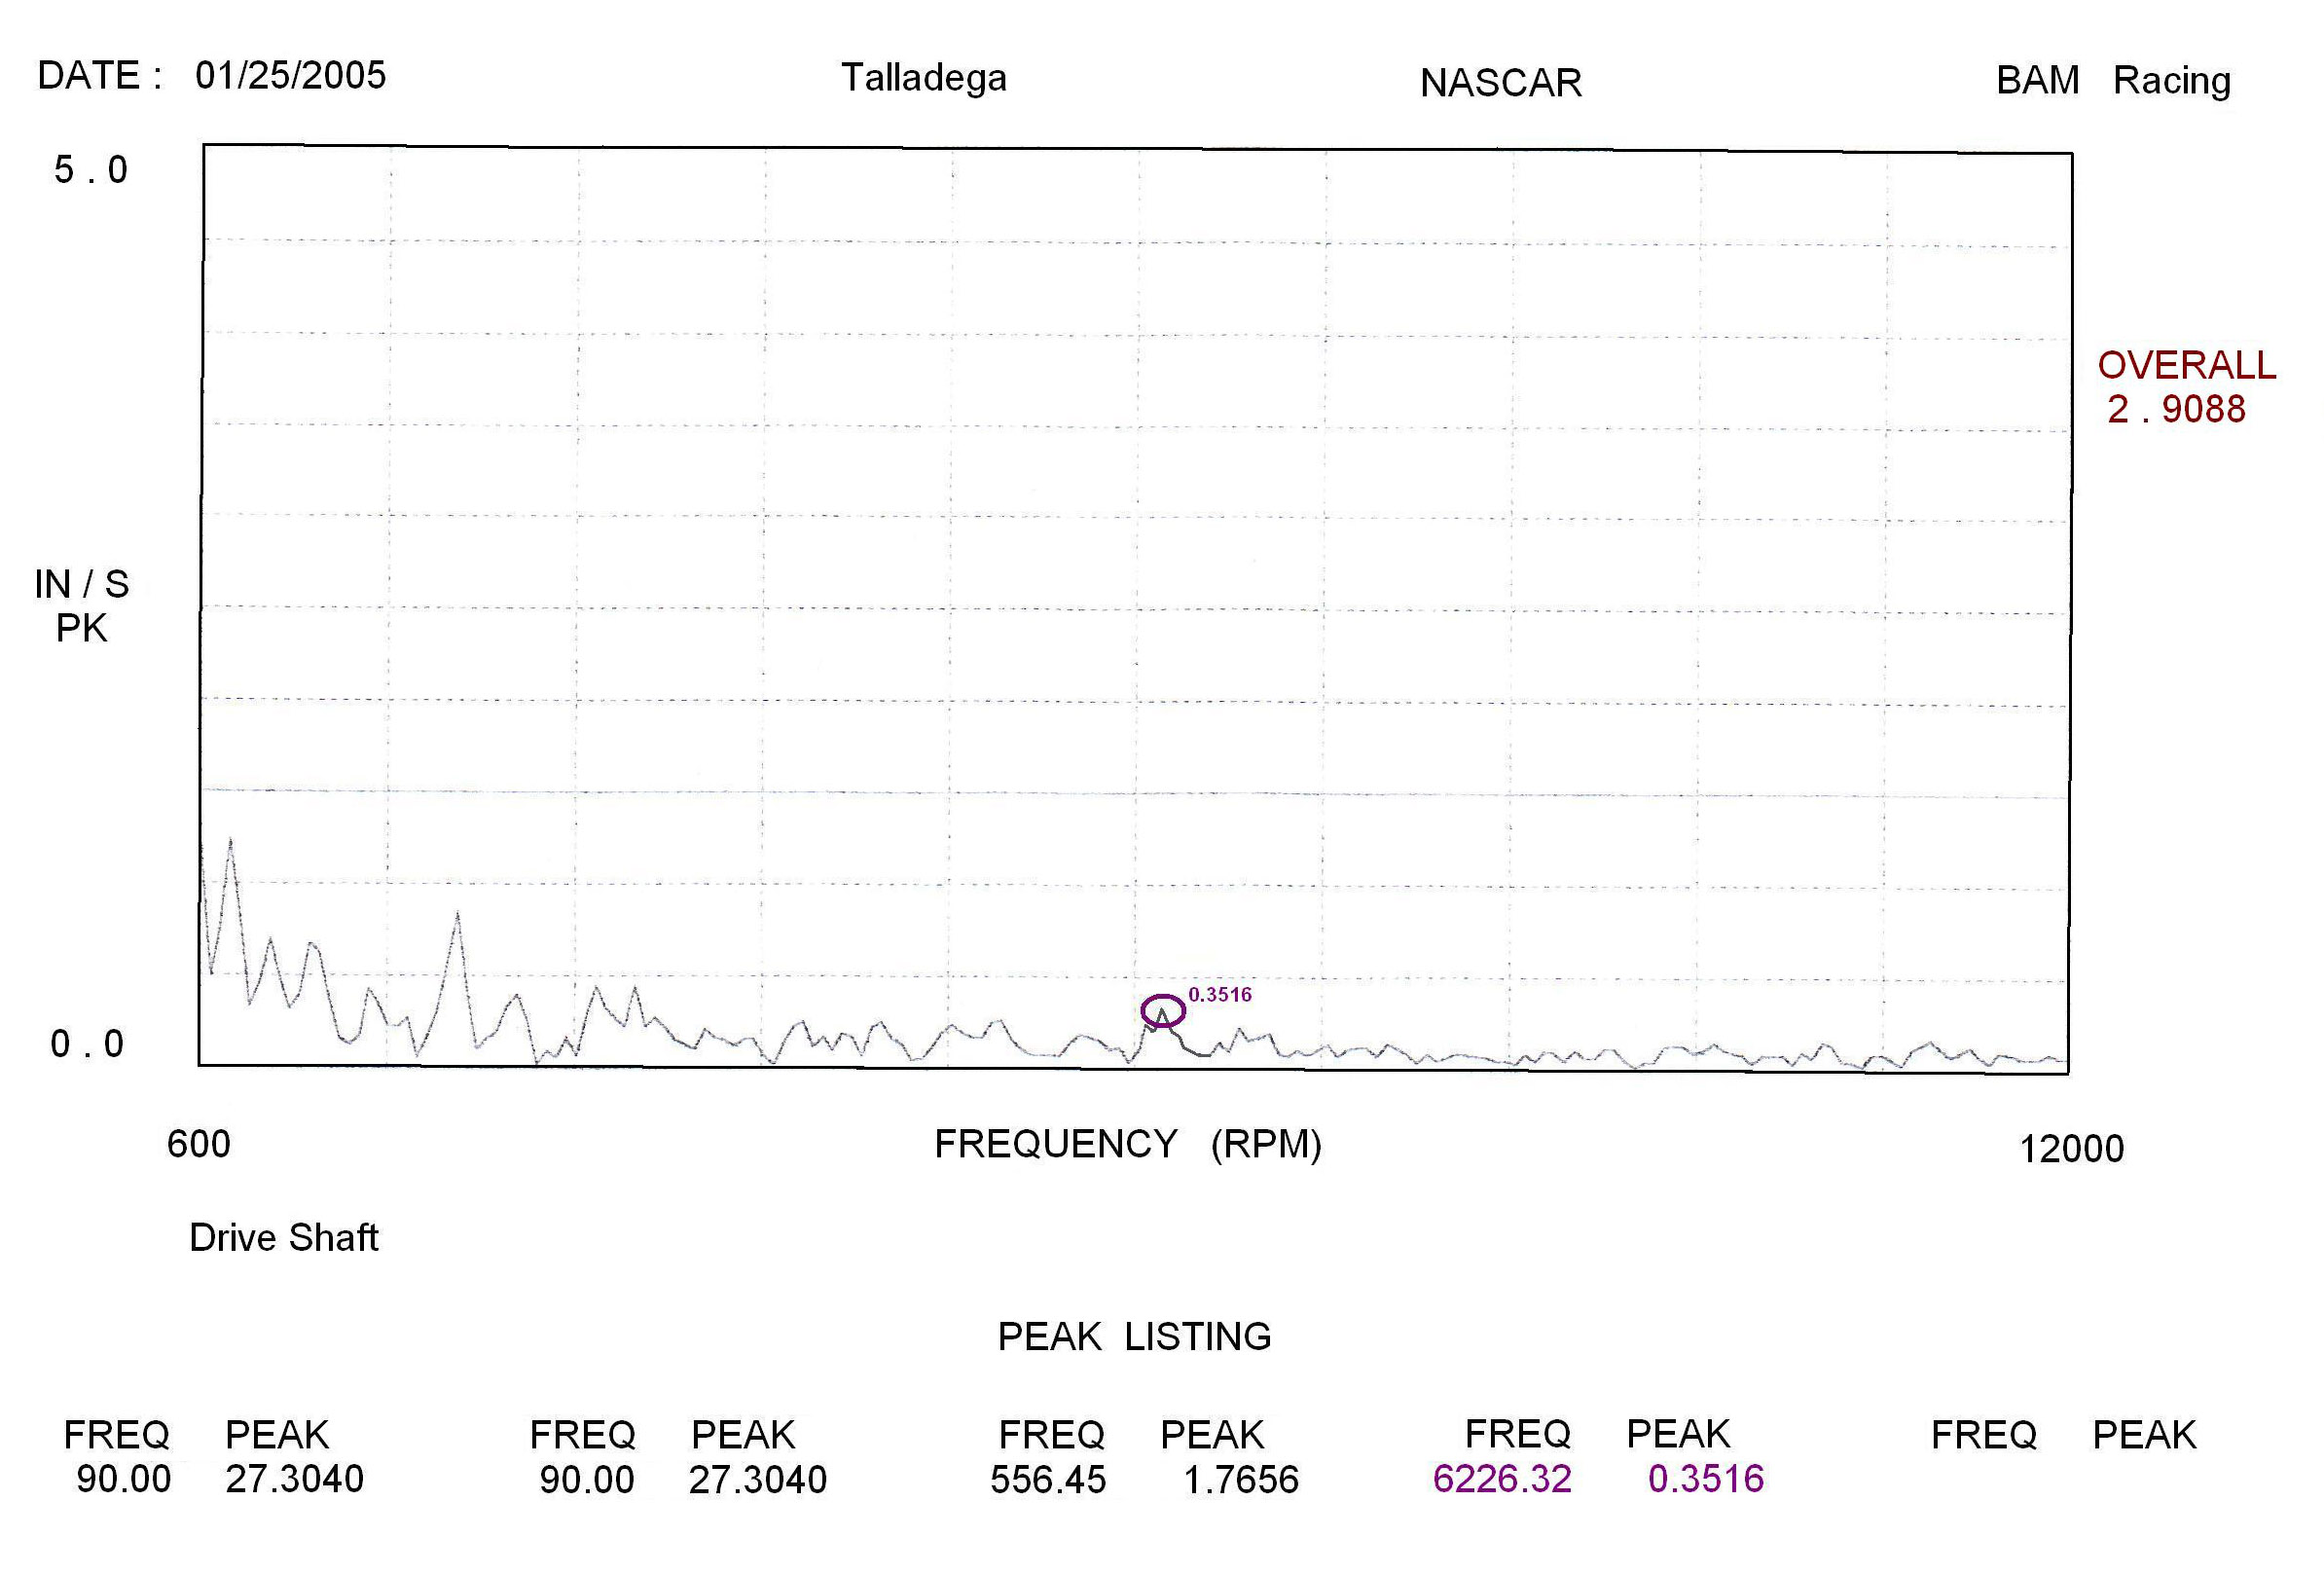 Figure 5 - Drive Shaft AFTER
 As the final vibration measurements in Figure-4 and Figure-5 above were being recorded simultaneously. The Lap time on the 2.5 mile race track was clocked at 51.95 seconds and again at 51.88 seconds, an increase in speed of 0.18 to 0.25 seconds from the original 52.13 seconds clocked at the beginning of this test.
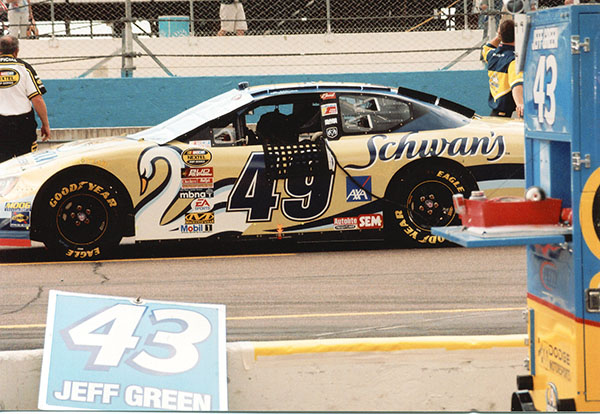
This same test car then raced in the Daytona 500 and was clocked as one of the four fastest cars on the track breaking the 190 mph barrier with installed restrictor plates.