Operation and Maintenance Costs of Wind Generated Power
Operation and maintenance (O&M) costs constitute a sizeable share of the total annual costs of a wind turbine. For a new turbine, O&M costs may easily make up 20-25% of the total levelized cost per kWh produced over the lifetime of the turbine. If the turbine is fairly new, the share may only be 10-15%, but this may increase to at least 20-35% by the end of the turbine’s lifetime. As a result, O&M costs are attracting greater attention, as manufacturers attempt to lower these costs significantly by developing new turbine designs that require fewer regular service visits and less turbine downtime.
O&M costs are related to a limited number of cost components, including:
- Insurance;
- Regular maintenance;
- Repair;
- Spare parts, and
- Administration.
Some of these cost components can be estimated relatively easily. For insurance and regular maintenance, it is possible to obtain standard contracts covering a considerable share of the wind turbine’s total lifetime. Conversely, costs for repair and related spare parts are much more difficult to predict. And although all cost components tend to increase as the turbine gets older, costs for repair and spare parts are particularly influenced by turbine age; starting low and increasing over time.
Due to the relative infancy of the wind energy industry, there are only a few turbines that have reached their life expectancy of 20 years. These turbines are much smaller than those currently available on the market. Estimates of O&M costs are still highly unpredictable, especially around the end of a turbine’s lifetime; nevertheless a certain amount of experience can be drawn from existing, older turbines.
Based on experiences in Germany, Spain, the UK and Denmark, O&M costs are generally estimated to be around 1.2 to 1.5 eurocents (c€) per kWh of wind power produced, over the total lifetime of a turbine. Spanish data indicates that less than 60 per cent of this amount goes strictly to the O&M of the turbine and installations, with the rest equally distributed between labour costs and spare parts. The remaining 40 per cent is split equally between insurance, land rental and overheads.
Figure 1.6, shows how total O&M costs for the period between 1997 and 2001 were split into six different categories, based on German data from DEWI. Expenses pertaining to buying power from the grid and land rental (as in Spain) are included in the O&M costs calculated for Germany. For the first two years of its lifetime, a turbine is usually covered by the manufacturer’s warranty, so in the German study O&M costs made up a small percentage (2-3%) of total investment costs for these two years, corresponding to approximately 0.3-0.4 c€ /kWh. After six years, the total O&M costs increased, constituting slightly less than 5% of total investment costs, which is equivalent to around 0.6-0.7 c€/kWh. These figures are fairly similar to the O&M costs calculated for newer Danish turbines (see below).
Figure 1.6: Different Categories of O&M costs for German Turbines, as an Average over the Time Period 1997-2001. Source: DEWI.
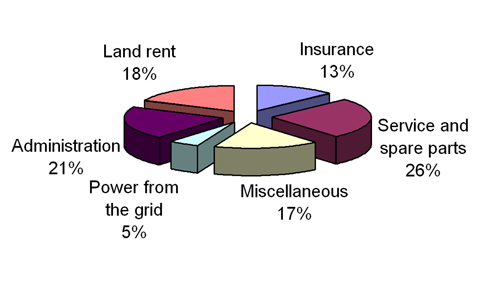
Figure 1.7 shows the total O&M costs resulting from a Danish study, and how these are distributed between the different O&M categories, depending on the type, size and age of the turbine. For a three-year-old 600 kW machine, which was fairly well represented in the study, approximately 35% of total O&M costs covered insurance, 28% regular servicing, 11% administration, 12% repairs and spare parts, and 14% for other purposes. In general, the study revealed that expenses for insurance, regular servicing and administration were fairly stable over time, while the costs for repairs and spare parts fluctuated considerably. In most cases, other costs were of minor importance.
Figure 1.7: O&M Costs as Reported for Selected Types and Ages of Turbines. Source: Jensen et al. (2002)
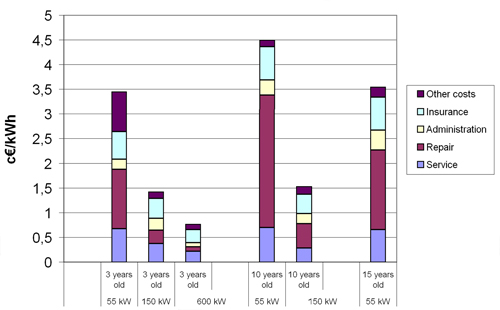
Figure 1.7 also shows the trend towards lower O&M costs for new and larger machines. So for a three year old turbine, the O&M costs decreased from around 3.5 c€/kWh; for the old 55 kW turbines to less than 1 c€/kWh for the newer 600 kW machines. The figures for the 150 kW turbines are similar to the O&M costs identified in the three countries mentioned above. Moreover, Figure 1.7 shows clearly that O&M costs increase with the age of the turbine.
With regard to the future development of O&M costs, care must be taken in interpreting the results of Figure 1.7. Firstly, as wind turbines exhibit economies of scale in terms of declining investment costs per kW with increasing turbine capacity, similar economies of scale may exist for O&M costs. This means that a decrease in O&M costs will be related, to a certain extent, to turbine up-scaling. And second, the newer and larger turbines are better aligned with dimensioning criteria than older models, implying reduced lifetime O&M requirements. However, this may also have the adverse effect that these newer turbines will not stand up as effectively to unexpected events.
Reference: Morthorst, Poul Erik, Senior Research Specialist, RisØ National Laboratory, Denmark. WIND ENERGY – THE FACTS, Volume-2 COST & PRICES. March 19, 2004.
Decrease Operation and Maintenance Costs
It has been recognized by many different industries that vibration is a cause of structural and equipment failure. We can smooth the windmill and extend the structural life of the wind turbine; which will then decrease your Operation and Maintenance (O&M) costs in service and spare parts.
The wind turbine, aviation, boating, automotive racing and other industries dealing with rotating components are significantly impacted by the effects of vibration. It costs these industries millions of dollars in maintenance and repair. We can reduce the amount of stress on equipment, allowing more efficient operation, which saves our customers time, effort and money. We guarantee it. Our goal is to provide you with the solutions that make for more efficient operation, while improving your overall SAFETY, increasing your readiness and minimizing unnecessary expenditures.
Basic Balancing Technologies Applied on the Wind Turbine
Reference: ERNEUERBARE ENERGIN – August 2009
Figure-1: SPECTRUM PLOT BEFORE BALANCE
It has been demonstrated by using the PRÜFTECHNIK Group VIBXPERT Balancer, that the wind turbine can be balanced. In this example, it required four separate runs to achieve marginal results. In Figure-2, below, Please note the zigzag trail between each adjustment point within the polar graph – this is a common nonlinear balance phenomenon causing each adjustment to miss its intended balance goal or the bull’s-eye (center) of zero vibration on the polar chart. The first adjustment response was a test weight adjustment to determine the weight adjustment’s balance response.
Reference: VIBXPERT Balancer, ERNEUERBARE ENERGIN – August 2009
Figure-2: POLAR CHART WIEGHT BALANCE RESPONSE
Reference: ERNEUERBARE ENERGIN – August 2009
Figure-3: SPECTRUM PLOT AFTER BALANCE
The above spectrum plot shows that balancing did make the system smoother, as also indicated on the polar chart in Figure-2. Balancing, even with marginal results with basic balancing technologies, validates the idea that a smoother windmill will decrease the overall harmful stress on the wind turbine; which in turn lowers the O&M costs.
We can utilize the measurement as described above and calculate a more refine smoothing adjustment. If any nonlinear issues are experienced during the balancing process, we can still formulate a working solution with better results. This algorithm adapt to adjustments made during the balancing process by storing “actual vibration results” from each successive balance run and uses this information to fine-tune future balance calculations, overcoming nonlinear conditions. In fact, the algorithms actually improve its ability to calculate a quick and accurate solution every time it is used. Enabling fewer adjustments in fewer runs and achieves lower vibration levels.